Deliverability overview and health score
The Email Delivery hub is your central view of sending infrastructure health - covering domains, inboxes, warmup status, and placement scores in one place.
Overview
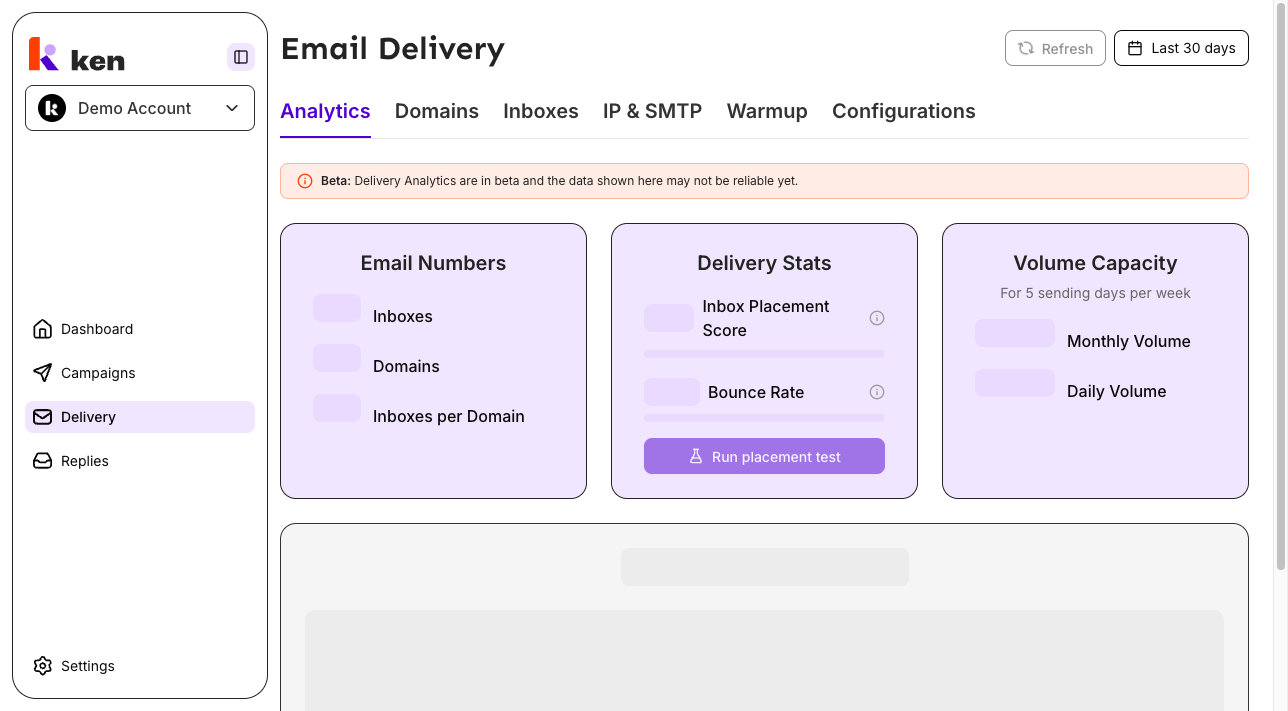
The Email Delivery page gives you a live picture of every domain and inbox in your workspace. It surfaces three summary cards, a trend chart, and two detail tabs so you can spot problems before they hurt campaign performance.
Find it in the left sidebar under Delivery. The page URL is /delivery.
Three tabs are visible to all users:
| Tab | What it shows | |-----|---------------| | Analytics | Summary cards (Email Numbers, Delivery Stats, Volume Capacity) and a trend chart | | Domains | Per-domain health, DNS status, placement rates, and engagement metrics | | Inboxes | Per-inbox Delivery Score, status, engagement metrics, and signature management |
Before you start
- You must be a member of an active workspace. If no workspace is selected, the page shows an access prompt.
- Viewing delivery data requires a role with analytics read access. If your role is restricted, the page shows an "access blocked" message.
- The page serves cached data by default (see How it works). Use the Refresh button when you need current data.
How to use the Delivery hub
Read the Analytics tab
- Open Delivery from the sidebar. The Analytics tab loads by default.
- Read the three summary cards at the top:
- Email Numbers - total inboxes, total domains, and inboxes per domain. Each count shows an "active" subset below it (for example, "12 active" out of 15 total inboxes).
- Delivery Stats - Inbox Placement Score (percentage of emails landing in the primary inbox) and Bounce Rate (percentage of emails that failed to deliver), each shown as a number and a progress bar.
- Volume Capacity - estimated Monthly Volume and Daily Volume capacity based on active inboxes.
- Read the trend chart below the cards to see how delivery health has moved over time.
- Use the date range picker in the top-right corner to change the analysis window. Preset options include Last 7 days, Last 30 days, Last 3 months, and others. You can also enter a custom range.
Note: Delivery Analytics are currently in beta. The numbers on this tab may not be fully reliable yet. A banner on the tab reminds you of this.
Check the Inboxes tab
- Click the Inboxes tab.
- The table shows every inbox in your workspace with these columns:
- Inbox - the sending email address
- First Name / Last Name - the sender identity
- Signature - a preview of the inbox signature; click to edit or add
- Status - one of Active, Warming up, Inactive, or Unknown
- Delivery Score - a 0-100 health grade shown as a number and a bar (described in detail below)
- Emails Sent - volume sent over the selected date range
- Reply Rate - distinct replies divided by emails sent
- Click Rate - human clicks divided by emails sent
- Bounce Rate - failed deliveries divided by emails sent
- Daily Limit - the configured sending cap for this inbox
- Created Date - when the inbox was added
- Tag - any tag applied to this inbox
- Click any managed inbox row (or the expand icon next to its email address) to open the edit panel.
- Use the three-dot actions menu on any managed inbox row for quick actions: Edit inbox, Assign IP, Configure warmup, or Delete inbox.
Check the Domains tab
- Click the Domains tab.
- The table shows your sending domains with status, DNS health, placement rate, and engagement metrics.
- Use the filter and sort controls to narrow to domains in a particular state.
- Click an edit action on any domain row to update its settings.
Refresh the data
The whole page caches for 24 hours. If you need the latest data right now:
- Click the Refresh button in the top-right corner.
- A spinning icon appears while data is being fetched. The button is disabled until all queries finish.
- Any change you make (editing an inbox, updating a domain) immediately reflects in the view - writes bypass the cache.
How it works
The 24-hour cache
The Email Delivery section deliberately serves cached data for up to 24 hours. This includes the analytics summary, inbox list, domain list, DNS health, and warmup status. The cache persists across page reloads - pressing Cmd+R in your browser does not pull fresh data. Only the Refresh button busts the cache.
This is intentional. Inbox fleets and domain DNS records change on the order of days, not seconds. Loading all that infrastructure data on every visit was slow and wasteful. The 24-hour cache makes the page open instantly.
When you make a change - for example, editing an inbox or retagging a domain - the platform invalidates only the affected queries. Your own edits are always immediately visible; everything else stays cached.
If a backend request fails transiently, the failure is not cached. The next time you visit the page, the data will try to load again. This prevents a one-second outage from locking a control empty for a full day.
The Delivery Score
Each inbox has a Delivery Score from 0 to 100 that answers one question: how likely is this inbox to land in the primary inbox right now?
The score fuses up to five signals:
| Signal | Weight | What it measures | |--------|--------|-----------------| | Placement | 35% | Inbox placement rate from the latest placement test | | Bounce | 25% | Weighted bounce rate over the past 30 days (inverted - lower is better) | | Provider | 20% | The warmup provider's own deliverability score | | Reply | 10% | Reply rate scaled against a 5% target | | Click | 10% | Human click rate scaled against a 3% target |
The score bands are:
- Healthy - 80 or above
- At Risk - 60 to 79
- Critical - below 60
- Unknown - no signal data available at all
Coverage-aware scoring. A brand-new inbox may not have placement test results yet, or may not be on a warmup provider. Missing signals are dropped and the remaining weights are renormalized - the inbox is scored only on the evidence that actually exists. This means a new inbox is not penalized for data it legitimately cannot have yet.
Hard vs. soft bounces. The bounce signal counts hard bounces at full weight (1.0), unknown bounces at 0.7, and soft bounces at 0.4. A hard bounce is a permanently dead address; a soft bounce is a temporary delivery failure. The distinction matters for the score.
Placement freshness. A placement test older than 21 days is treated as missing, not as old data. The inbox is scored on its other signals until a fresh test runs.
Domain score. The score shown for a domain on the Domains tab is the plain average of all its inboxes' non-null scores.
The score is recomputed every night at around 02:30 UTC, after the previous day's reply, click, and bounce counts have been finalized.
Rate math
Engagement metrics (Reply Rate, Click Rate, Bounce Rate) on both the Inboxes and Domains tabs are computed as follows:
- Reply and click counts are deduplicated to unique contacts. If a lead replied twice, that counts as one reply.
- Bot clicks are stripped. Only human clicks count toward Click Rate.
- If an inbox has sent zero emails in the selected window, its rate is shown as "--" (no data), not 0%. A brand-new inbox is not failing; it just has not started.
- Domain-level rates are volume-weighted. The rates are not averaged across inboxes - all numerators are summed and divided by all denominators. This prevents a low-volume inbox from skewing the domain's numbers.
Troubleshooting and debugging
Symptom: The page shows "access blocked" or an empty state.
- Cause: No active workspace is selected, or your role does not have delivery analytics access.
- Check: Confirm you have an active workspace selected in the workspace switcher. If the error says "AUTH_FORBIDDEN," your role does not permit access - ask an admin.
Symptom: Numbers look stale or do not reflect a recent change.
- Cause: The 24-hour cache is serving old data.
- Fix: Click the Refresh button in the top-right corner. Do not reload the browser tab - that serves the cache on purpose.
Symptom: The Refresh button spins but never stops.
- Cause: One or more backend queries are taking a long time or are failing silently.
- Check: Open the browser network tab and look for
/v1/analytics/deliverability/*requests. A timeout or 500 error here is the usual cause. Retry in a few minutes. If it persists, contact support.
Symptom: The Delivery Score shows "--" (no data) for an inbox.
- Cause: The inbox has no signals yet - it may be brand new, not on a warmup provider, and has no completed placement test.
- Check: Confirm the inbox has sent emails and that warmup is configured. Run a placement test from the Delivery Stats card. The score will populate on the next nightly run.
Symptom: An inbox scores "Unknown."
- Cause: None of the five signals returned a value. This usually means the inbox is very new or warmup is not set up.
- Fix: Configure warmup, send some emails, and run a placement test. Give it 24-48 hours.
Symptom: A placement test result does not appear in the score.
- Cause: Placement tests older than 21 days are treated as missing, not old data.
- Check: Look at the date of the last completed placement test for that inbox. If it is more than three weeks old, run a new one.
Symptom: Reply Rate or Click Rate shows "--" instead of a percentage.
- Cause: The inbox sent zero emails in the selected date range. This is not an error.
- Fix: Change the date range to a window where the inbox was actively sending, or wait until emails go out.
Symptom: The "Showing a partial view" warning banner appears on the Analytics or Inboxes tab.
- Cause: The workspace has more inbox-health data than a single request can return. The inbox list and summary numbers may be understated.
- Action: Contact support to get visibility into the full fleet.
Symptom: Numbers on Analytics are labeled "Beta" and look off.
- Cause: The Delivery Analytics pipeline is still being validated. The data may have inaccuracies.
- Action: Cross-reference against the Inboxes tab, which uses a separate data source. Report specific discrepancies to support.
FAQ
Why does reloading the page not show the latest data? The page caches all delivery data for 24 hours, including across browser reloads. This is intentional - the infrastructure data changes slowly and the cache makes the page open instantly. Use the Refresh button to pull fresh data.
How often is the Delivery Score updated? Once per day, at approximately 02:30 UTC. The score reflects the most recent placement test, warmup provider score, and engagement rates as of that run.
What does a Delivery Score of, say, 85 at low coverage mean? Coverage tracks how many of the five signals were present. A score of 85 built on two signals (say, bounce rate and provider score) is less certain than an 85 built on all five. Check which placement test and warmup data are available for that inbox and fill any gaps.
Why does a new inbox not show 0% for Reply Rate? A new inbox that has not sent anything in the selected window shows "--" instead of 0%. Zero percent would imply the inbox sent emails and got no replies; "--" correctly communicates that there is no data yet.
Can I see a breakdown of what went into a Delivery Score? A per-signal breakdown is available on the inbox detail view. Click the inbox address (or the expand icon) in the Inboxes table to open the edit panel, which includes the score breakdown when signal data is available.
Who can see the IP & SMTP, Warmup, and Configurations tabs? Those tabs are visible only to the internal Ken team and are not shown to client users.